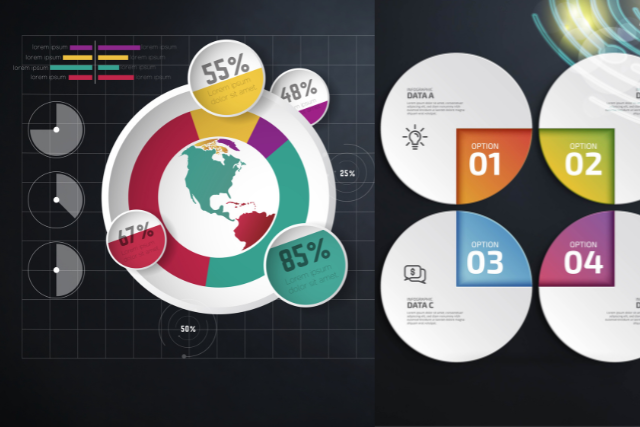
Conveying complex information in online courses can be a challenge. Infographics can be a powerful tool to overcome this. By turning dense material into clear visuals, you support visual learners and boost comprehension and retention for all students. Different types of infographics can clarify trends, simplify processes, and illustrate concepts effectively in your course.
Implementing these visuals begins by identifying areas where infographics can enhance learning. Choosing the right design tools ensures that the infographics you create are both visually appealing and instructional, supporting your overall teaching goals.
Key Takeaways
- Infographics simplify complex information, making it easier for students to understand and retain key concepts.
- Various types of infographics, such as statistical and process visuals, cater to different learning styles and content needs.
- Effective infographic design focuses on simplicity, clarity, and visual appeal to enhance student engagement.
- Incorporating infographics into course materials promotes active learning, helping students visualize and apply knowledge effectively.
- Measuring the impact of infographics through engagement and retention metrics helps evaluate their effectiveness in improving learning outcomes.
Importance of Infographics
Infographics play an essential role in improving online courses. They break down complex information into easy-to-digest visuals, helping learners grasp difficult concepts. In a fast-paced learning environment, quick understanding is key, and visuals serve this purpose effectively.
Infographics also address different learning styles. For instance, visual learners tend to remember content better when it’s shown in a graphic format. Including infographics in your course makes the material more accessible to everyone, enhancing overall comprehension.
Another benefit is improved retention rates. Research shows that visuals can significantly enhance memory recall. When students see information presented engagingly, they are more likely to remember it even after the course has ended. This boosts engagement and learning outcomes.
Types of Infographics
Understanding the types of infographics available can help you choose the right format for your course. Each type serves a different educational purpose:
- Statistical Infographics: Perfect for displaying numerical data visually. These help learners identify trends and patterns quickly.
- Informational Infographics: Provide clear explanations of concepts or processes. These are step-by-step guides ideal for walking students through a specific idea.
- Timeline Infographics: Display events in chronological order, which is useful for history lessons or explaining the progression of a project.
- Comparison Infographics: Show information side-by-side, helping students easily identify differences and similarities between two or more concepts.
- Process Infographics: Break down complex procedures into digestible steps, making it easier for learners to follow and understand complicated tasks.
Incorporating these infographic types into your course materials can make learning more dynamic and effective.
Designing Effective Infographics
Creating effective infographics involves more than just a good design. To engage your students and enhance their understanding, pay close attention to the data you select, the colours and fonts you use, and how well-organized your layout is.
Choosing Relevant Data
Choosing the right data for your infographic is crucial for maintaining relevance and clarity. Here are some practical tips:
- Align With Course Goals: Ensure that the data supports the main points you want to communicate. This keeps your infographic focused and informative.
- Keep It Simple: Select data that’s easy to understand and avoids unnecessary complexity. Simplicity is key to clarity.
- Source Credibly: Use data from trusted sources to add credibility to your infographic and build trust with your audience.
- Highlight Key Insights: Focus on the most important information to prevent overwhelming your students.
Colour and Typography Choices
Choosing the right colours and fonts can make your infographics not only more appealing but also more effective. For example, using a consistent colour scheme that matches your course theme promotes visual unity. Meanwhile, contrasting colours can help draw attention to important elements.
When it comes to fonts, readability is crucial. A simple sans-serif font for headings and a serif font for body text often strike the right balance between elegance and readability. Stick to a limited number of fonts and colours for consistency and focus on making key points stand out.
Layout and Structure Essentials
A well-structured infographic leads to better information retention. Keep these layout tips in mind:
- Visual Hierarchy: Use size, colour, and placement to guide the viewer’s eye through the infographic. Start with the most important information.
- Sections: Break content into clearly defined sections to make complex topics easier to understand.
- Logical Flow: Ensure your infographic flows naturally, whether you’re narrating a story or presenting facts.
- Whitespace: Use whitespace effectively to reduce clutter and emphasize the most important points.
By organizing your content in a visually appealing way, your infographic will be both informative and engaging.
Tools for Creating Infographics
There are numerous tools available that make creating infographics easier, depending on your skill level and needs.
- Canva: A user-friendly option for beginners, Canva offers pre-designed templates and easy drag-and-drop functionality.
- Piktochart: Ideal for turning complex data into simple visuals, Piktochart allows for the creation of infographics, reports, and presentations.
- Venngage: Another option for data visualization, Venngage is perfect for creating infographics with custom charts.
- Infogram: Great for interactive infographics that include live data and animations to make learning more engaging.
- Google Slides and PowerPoint: Basic tools like Google Slides or PowerPoint can be useful for creating simple infographics if you’re looking for a more straightforward approach.
Select the tool that fits your course goals and design skills. The right tool will help you create infographics that enhance your online learning content.
Incorporating Infographics in Courses
Infographics can significantly improve the quality of your online courses by making complex information easier to grasp. Here are a few ways to incorporate them effectively:
- Summarize Key Points: Use infographics to highlight key takeaways from a lecture or reading. This helps students focus on the most important information.
- Visualize Data: Display statistics and data in engaging ways that students can quickly understand and remember.
- Step-by-Step Guides: Use process infographics to break down complicated procedures. This ensures that students follow along and absorb the material.
- Collaborative Projects: Encourage students to create their own infographics as part of a group project. This not only fosters teamwork but also reinforces their understanding of the course material.
These strategies can boost engagement and comprehension in your courses.
Enhancing Student Engagement
Online students can sometimes feel disconnected from the learning process. Infographics are a powerful tool for boosting student engagement by presenting information in a more interactive format.
One effective way to engage students is to have them create their own infographics. This process allows them to explore the course material deeply and present it creatively. Additionally, incorporating discussion boards where students can share their infographics fosters a collaborative learning environment.
Consider adding interactive elements to your infographics, such as quizzes or clickable links. This turns passive learning into an engaging, active experience, helping students stay focused and motivated.
Improving Information Retention
Infographics are excellent tools for improving information retention. They help students break down and remember complex topics. Here’s how you can use infographics to enhance memory recall:
- Emphasize Key Points: Use bold text or symbols to make the most important information stand out.
- Colour Coding: Assign different colours to different categories of information, helping students mentally organize what they’re learning.
- Visual Storytelling: Create a narrative flow within your infographic that connects concepts, making it easier for students to remember the material.
- Interactive Features: Allow students to interact with the infographics, whether through clickable elements or prompts for discussion.
These strategies help students retain critical information longer.
Case Studies and Examples
Several case studies highlight the effectiveness of using infographics in online learning. For example, a course in Environmental Science used infographics to visualize climate change data, resulting in a 30% increase in student understanding of key concepts. Similarly, a Business Management course that employed infographics to explain market trends saw a 25% improvement in retention rates.
| Course Title | Infographic Focus | Improvement in Learning |
|---|---|---|
| Environmental Science | Climate Change Data | 30% |
| Business Management | Market Trends | 25% |
| Health Education | Nutrition Guidelines | 20% |
| History 101 | Timeline of Historical Events | 35% |
These examples demonstrate that incorporating infographics can lead to measurable improvements in learning outcomes.
Measuring Impact and Effectiveness
Once you’ve incorporated infographics into your course, it’s important to measure their effectiveness. Here are key metrics to track:
- Engagement: Monitor how frequently students interact with the infographics—whether they’re clicked, shared, or how long students spend viewing them.
- Retention: Compare the retention rates for information presented through infographics with those presented in traditional formats.
- Feedback: Survey your students for feedback on how effective they find the infographics. Ask about their clarity, usefulness, and engagement levels.
- Performance: Assess students’ test scores and assignments before and after using infographics to determine if learning outcomes improve.
Measuring these factors will help you refine your approach to using infographics in future courses.
Best Practices for Implementation
To make the most of infographics in your online courses, follow these best practices:
- Focus on Simplicity: Avoid overloading infographics with too much information. Keep them clear and easy to understand.
- Engage Students: Encourage active learning by getting students involved in creating or interacting with infographics.
- Use the Right Tools: Platforms like Canva and Piktochart make designing attractive, functional infographics easy.
By incorporating these best practices, you’ll improve student engagement, retention, and overall learning experience.
Frequently Asked Questions
Can Infographics Be Used for Assessments in Online Courses?
Yes, infographics can be used for assessments. They help simplify complex concepts, engage learners visually, and encourage critical thinking. Ensure they align with your learning objectives.
What Formats Work Best for Sharing Infographics With Students?
Sharing infographics as PDF downloads, interactive web pages, or embedded presentations works well. These formats engage students and cater to various learning preferences.
Are There Accessibility Considerations for Infographics?
Yes, it’s important to ensure accessibility by using high contrast, readable fonts, and providing alt text for images to make infographics usable by all learners.
How Can Infographics Complement Traditional Teaching Methods?
Infographics can complement traditional teaching by simplifying complex ideas, engaging visual learners, and offering quick reference points, thereby enhancing the overall learning experience.
What Are Common Mistakes to Avoid When Creating Infographics?
Avoid cluttered designs, excessive text, and poor colour choices. Focus on delivering a clear, concise message that enhances understanding.
Conclusion
Infographics are a powerful tool for enhancing online learning. They make complex information more accessible, boost retention, and appeal to different learning styles. By using the right tools and following best practices, you can create infographics that significantly improve your teaching effectiveness.
Start integrating infographics into your course today and transform the way your students learn!


